CLASHub Logo

CLASHub Database Tutorial

This short tutorial walks you through the three database search modes available on the CLASHub home page: CLASH, Gene Expression, and microRNA Expression. You’ll learn the required steps, how autocomplete works, and how to avoid common submission issues.

Annotated CLASH search and results overview (numbers 1–8)
Figure 1. User interface for querying miRNA-target hybrids in the CLASH database.
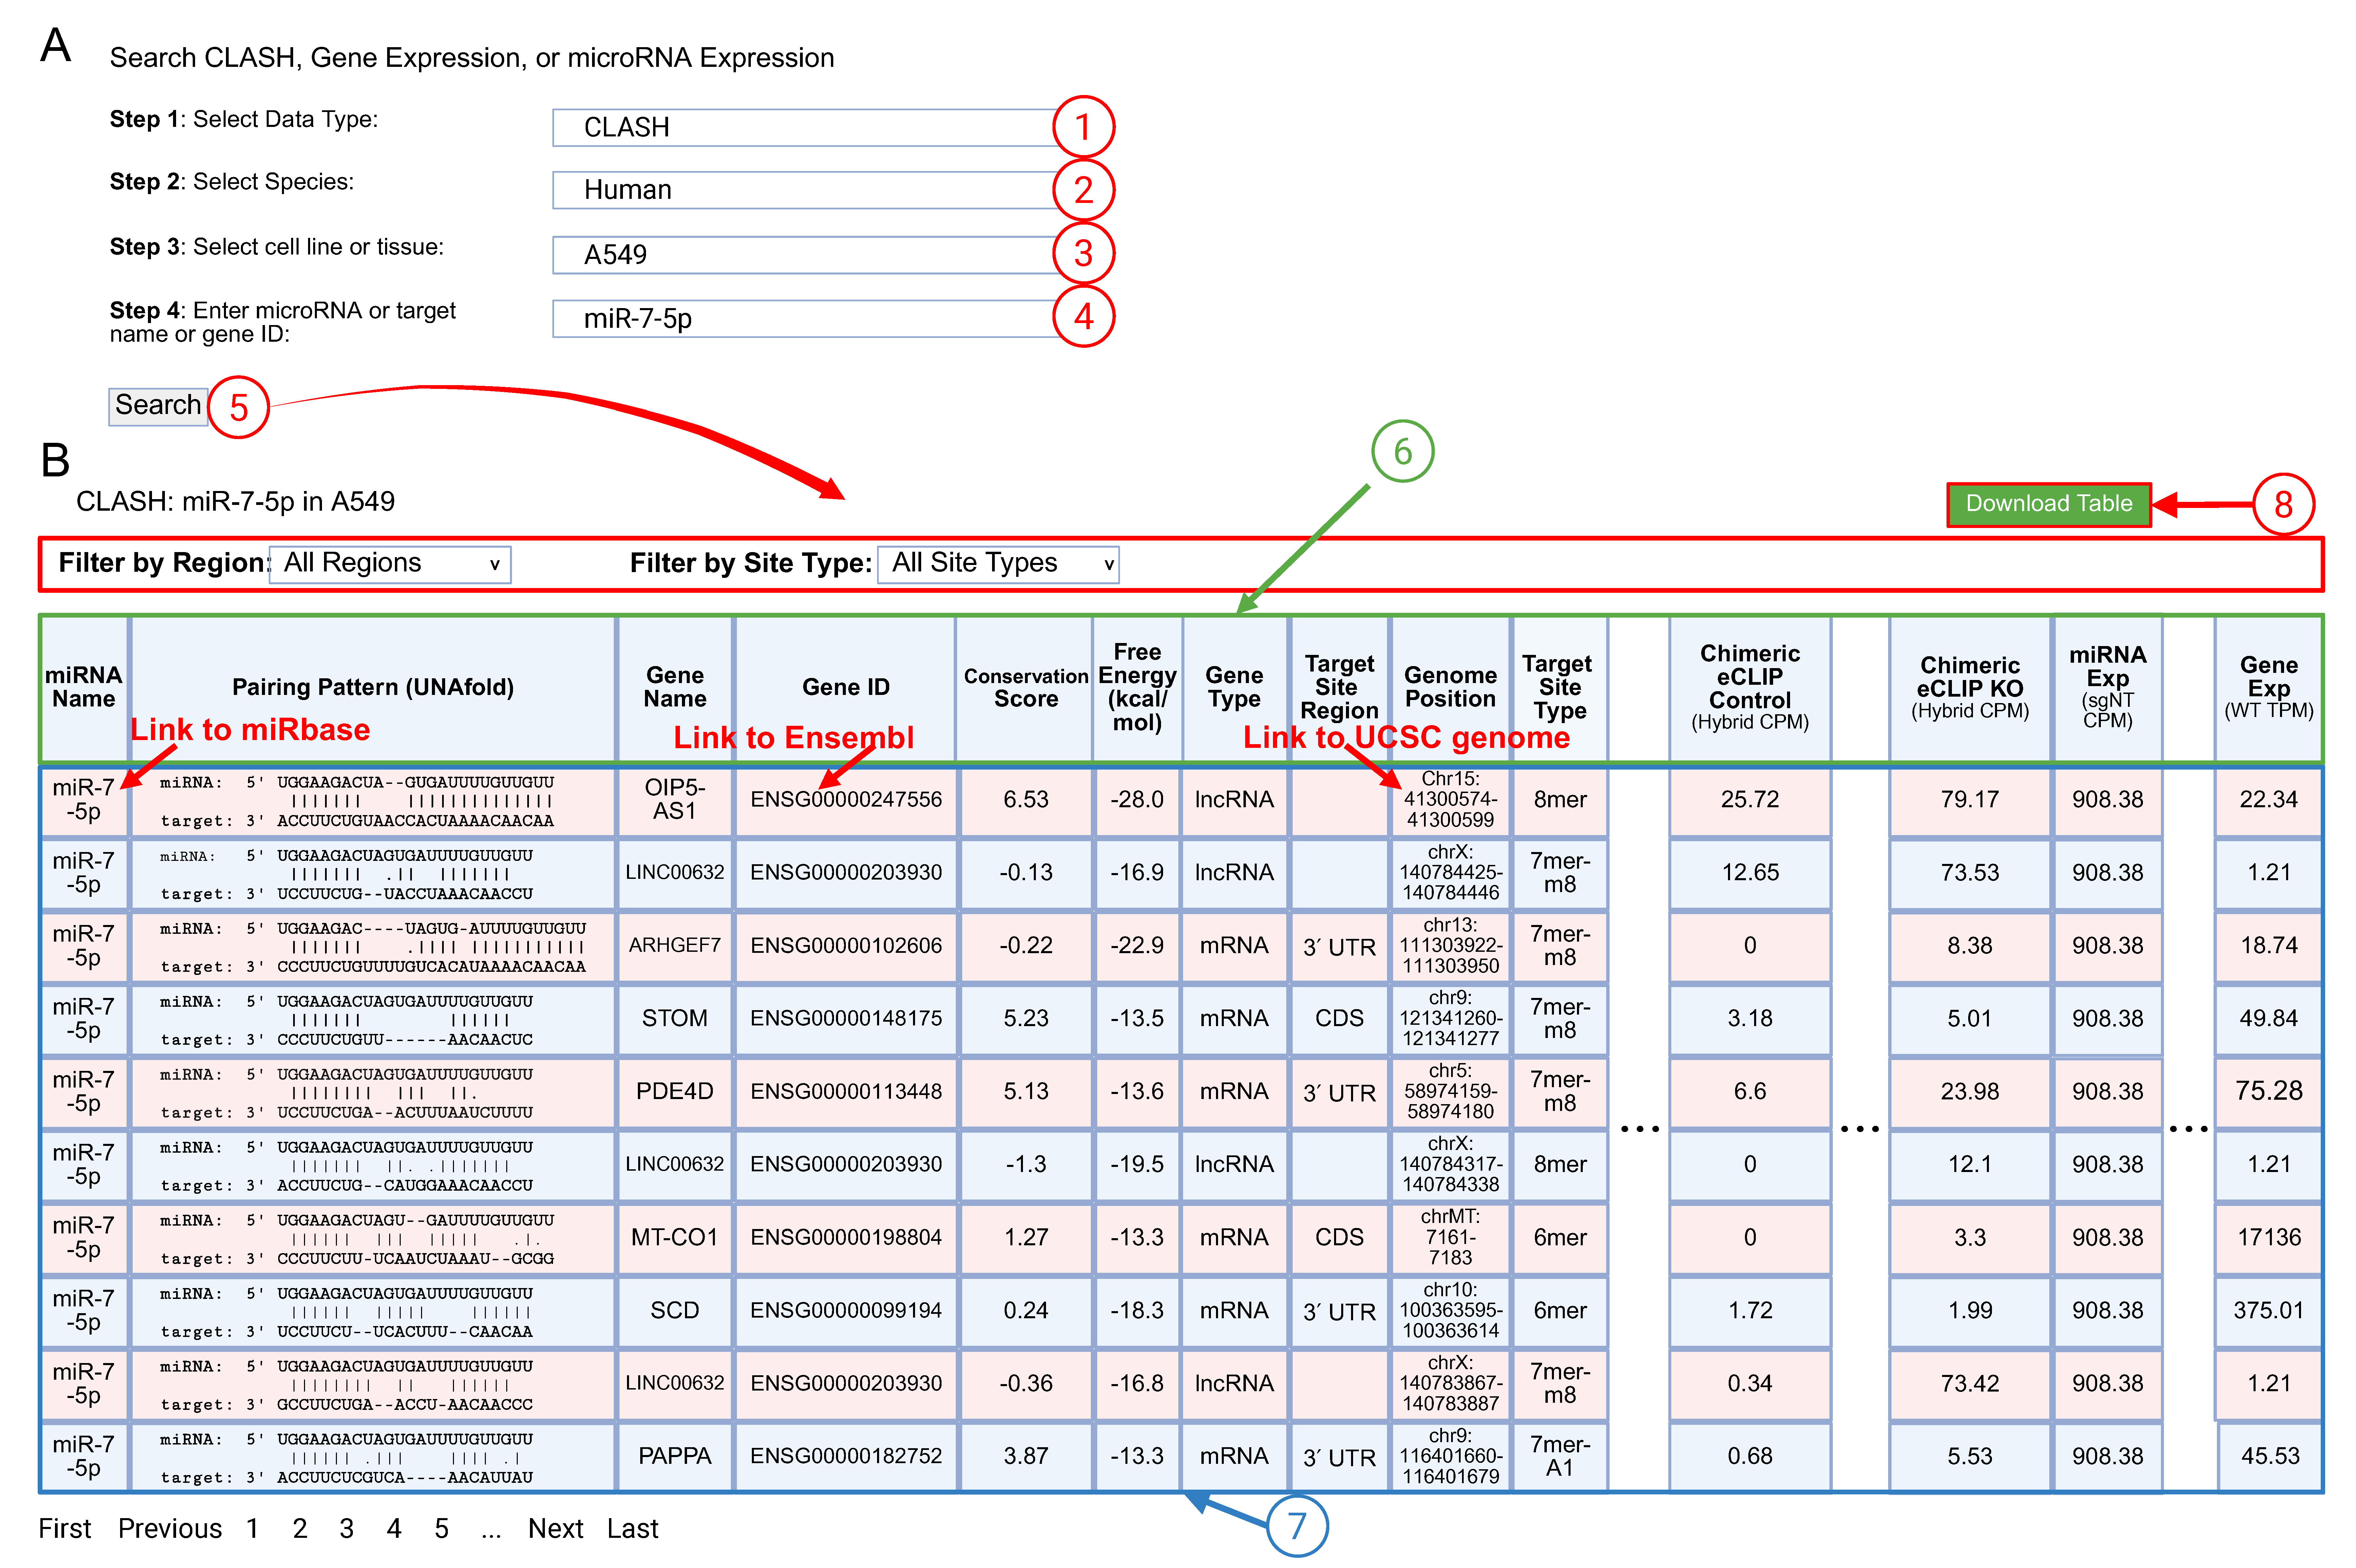
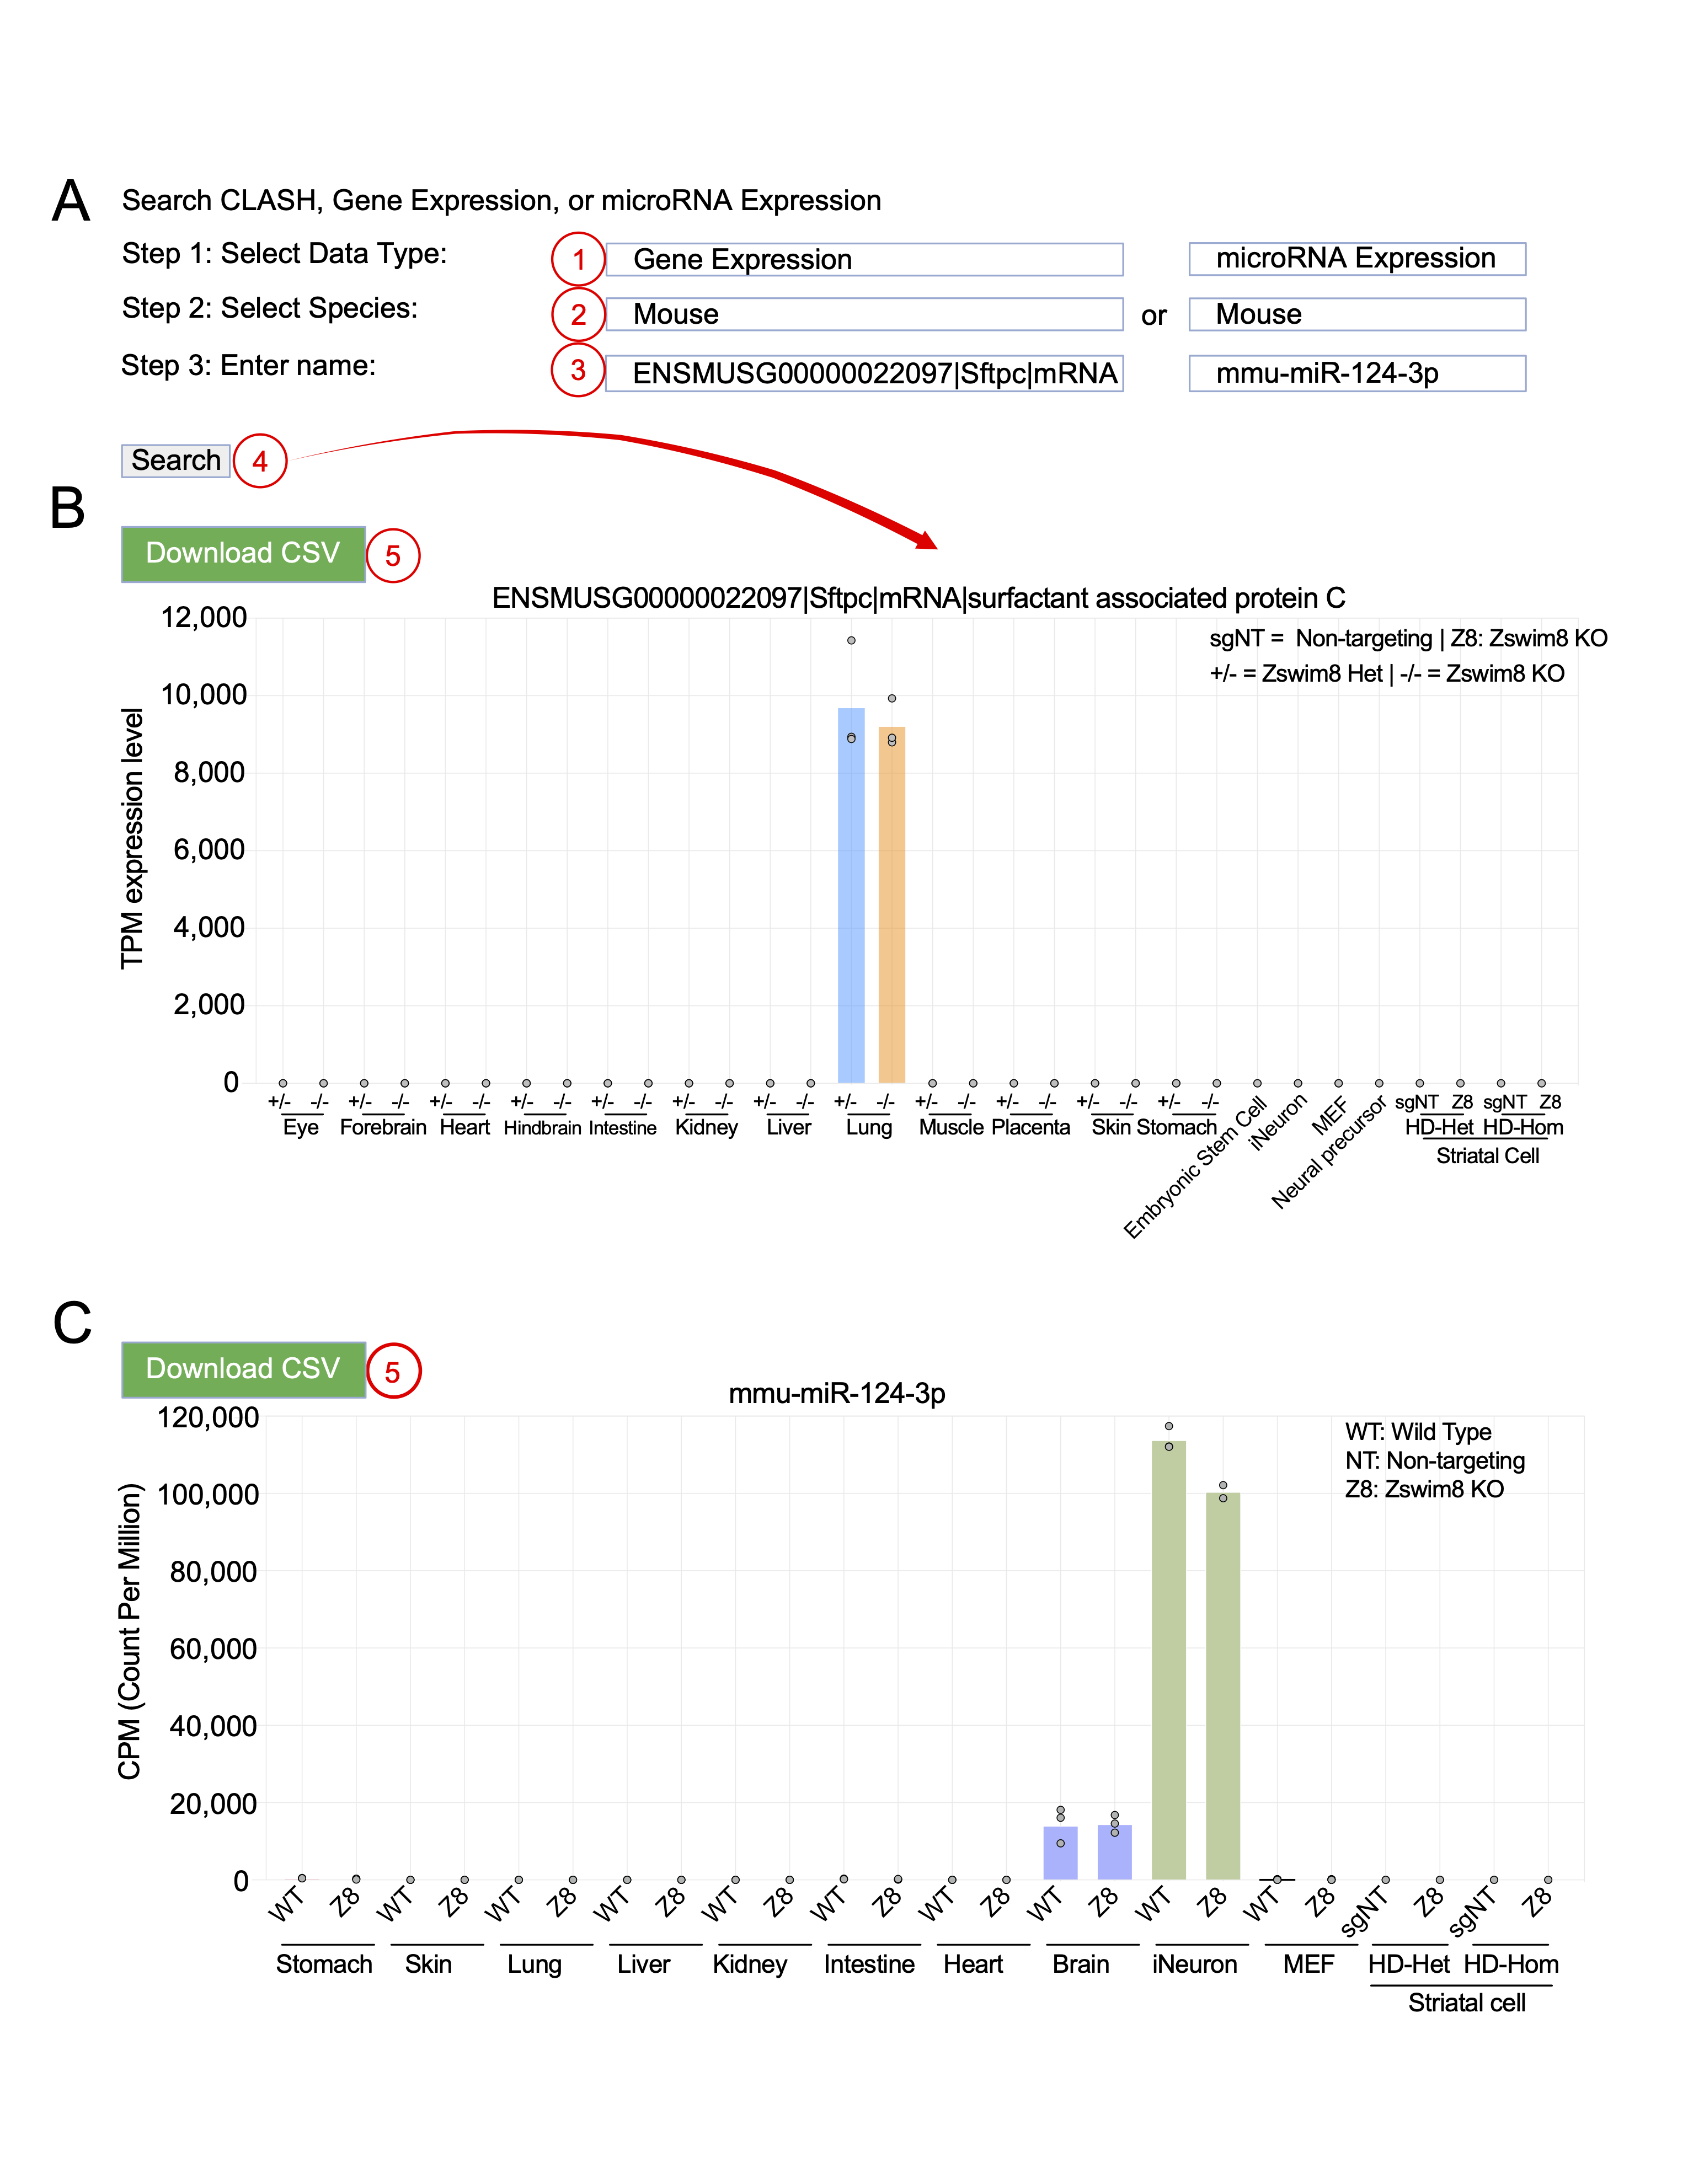
(A) The CLASHub web interface guides users by selecting 1 data type, 2 species, 3 sample type and 4 miRNA or gene ID in the query fields, then performing the 5 Search function.
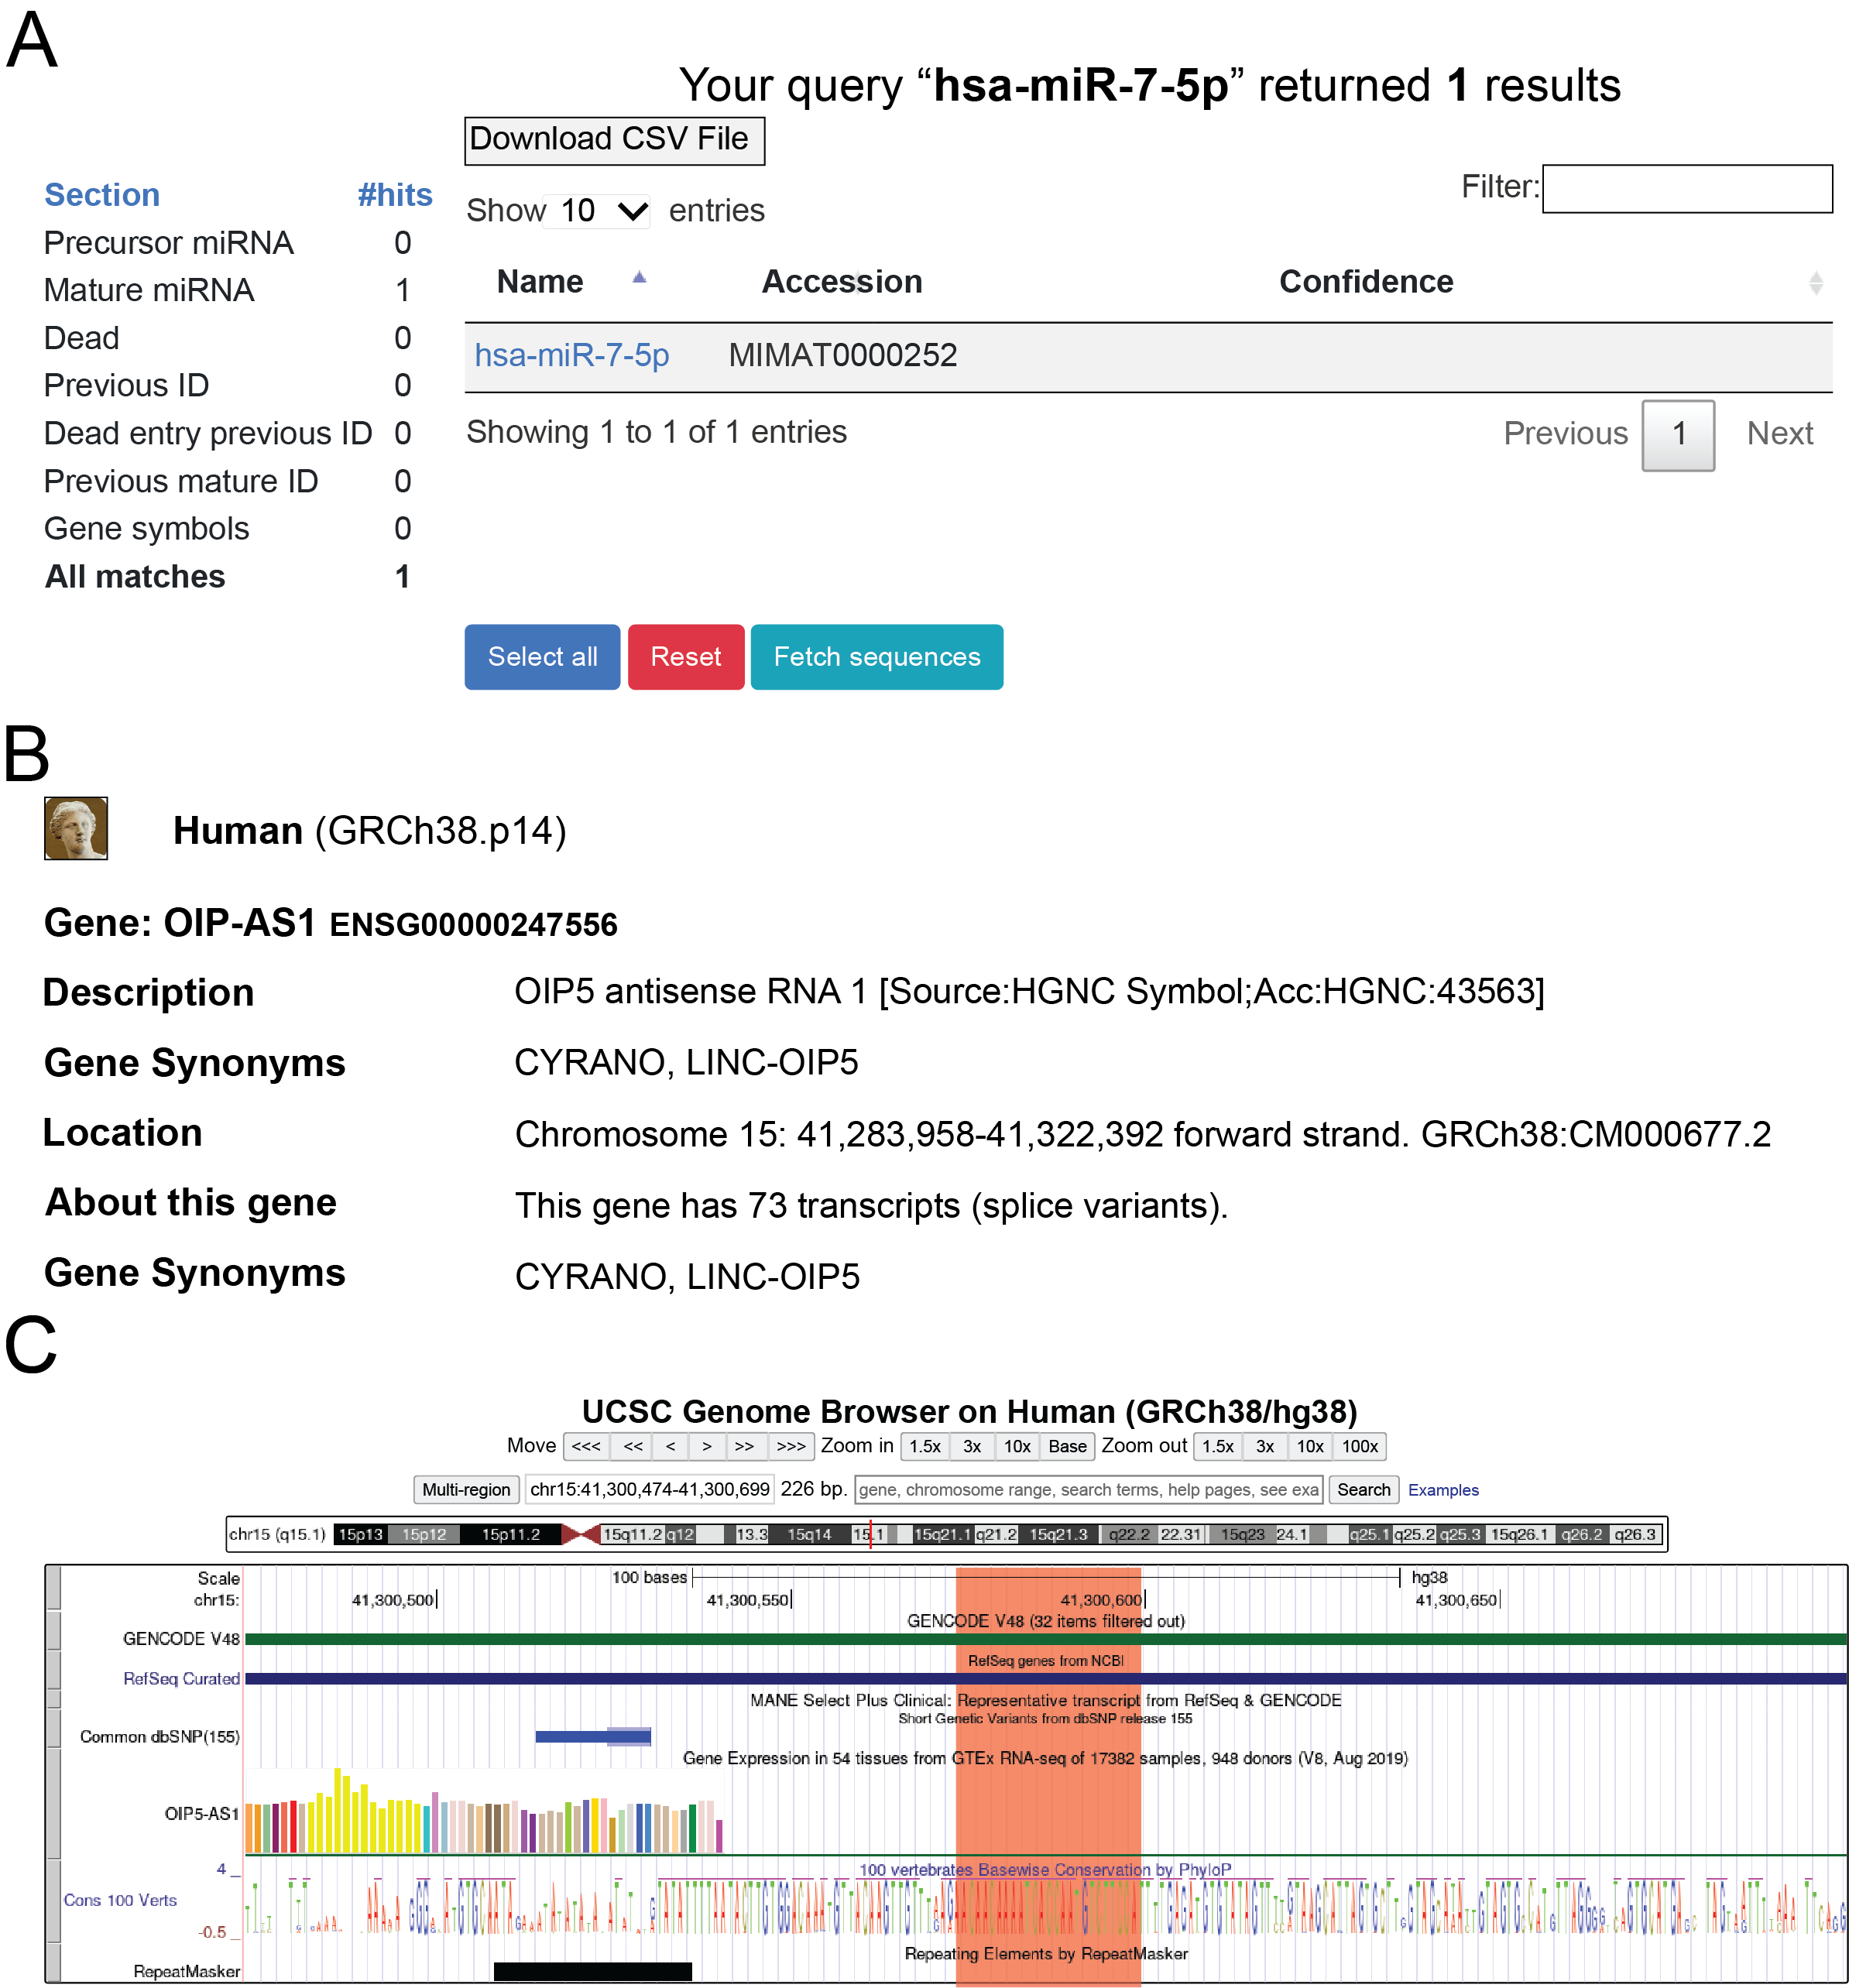
(B) The example CLASH output table summarizes detected miR‑7 hybrids in A549 cells (6). Each row (7) includes comprehensive information (miRNA name, predicted pairing pattern, gene, gene ID, genome position, target site type, and abundance metrics). The 8 Download Table button exports the table for offline analysis. Interactive links allow opening miRBase (via miRNA name), Ensembl (via gene ID), and UCSC Genome Browser (via genome position).

External resources

Example external resources linked from CLASH results table
Figure 2. Example external resources linked from the CLASH results table. (A) miRBase page opened by clicking on the miRNA name (hsa-miR-7-5p). (B) Ensembl gene summary page opened by clicking on the gene ID (OIP5-AS1). (C) UCSC Genome Browser view showing the genomic locus corresponding to the hybrid site.

Gene & microRNA Expression (RNA/miRNA-seq)

CLASHub gene and miRNA expression database interface and example outputs
Figure 3. CLASHub gene and miRNA expression database interface and example outputs. (A) User interface for exploring RNA-seq data and miRNA-seq data across tissue and cell types. Users 1 select the “Gene Expression” or “miRNA expression” in the data type, 2 specify the species, and 3 enter a gene name, Ensembl gene ID or miRNA name. 4 Clicking the Search retrieves expression profiles. Example output bar plots showing transcript abundance in TPM (Transcripts Per Million) (B) or miRNA abundance in CPM (Counts Per Million) (C) across mouse tissues and cell types. 5 The Download CSV button allows exporting the data table for offline analysis.