CLASHub Logo

Choose a V2 pipeline. Public data can be analyzed directly from an accession.

Job status Live · every 5 sec

Running Loading…

Waiting Loading…

INTERACTION DISCOVERY

CLASH V2 analysis

Process CLASH and compatible AGO-CLIP data with direct and peak-supported evidence.

  1. 1Source
  2. 2Files
  3. 3Settings
  4. 4Email confirmation
CLASH V2 analyzes AGO CLASH and compatible AGO-CLIP datasets, integrating Direct chimeric reads with AGO peak-supported candidate sites.
Choose your data source
Example files: Download R1 Download R2

Automatically selects adapter trimming or no trimming. The exact decision is recorded in the final report.

How it works

Auto-detect evaluates supported R1/R2 adapter candidates and no trimming, then continues with the best-supported preprocessing plan. The final HTML report shows the exact R1/R2 trimming sequences used—or confirms no adapter trimming—together with confidence, support, and the selection reason.

Uses local alignment evidence to detect left/right UMI bases and fixed technical anchors. Uncertain bases are preserved.

EXPRESSION ANALYSIS

miRNA-seq V2 analysis

Quantify miRNA abundance from original paired-end or single-end FASTQ reads.

  1. 1Input
  2. 2Samples
  3. 3Settings
  4. 4Submit
Select public SRRs or upload files to quantify miRNA expression.
Choose your data source

EXPRESSION ANALYSIS

RNA-seq V2 analysis

Quantify one or more independent RNA-seq samples using the selected library workflow. Group comparisons are separate.

  1. 1Input
  2. 2Samples
  3. 3Analysis
  4. 4Submit
Choose your data source
Read layout
I1/I2 files contain sample barcodes and cannot be used as R2 or as a single-end biological read.

2 Species and kit

Upload original, unprocessed FASTQ.gz files only. Do not trim adapters, extract UMIs or remove technical bases beforehand. Each sample must pass the required input and kit checks; otherwise analysis stops.

What is checked?

Saved kit rules and Others do not require a Luna lookup. Each sample is checked for adapters, technical read structure and strand on the analysis server. Others does not extract UMIs or remove PCR duplicates; unresolved structure may need review. Submit different methods separately.

3 Email and submit

Gene counts and TPM for each sample; exon/intron counts included.

No analysis starts until you confirm the email. Read structure and strand are checked separately for each sample.

RESULTS EXPLORATION

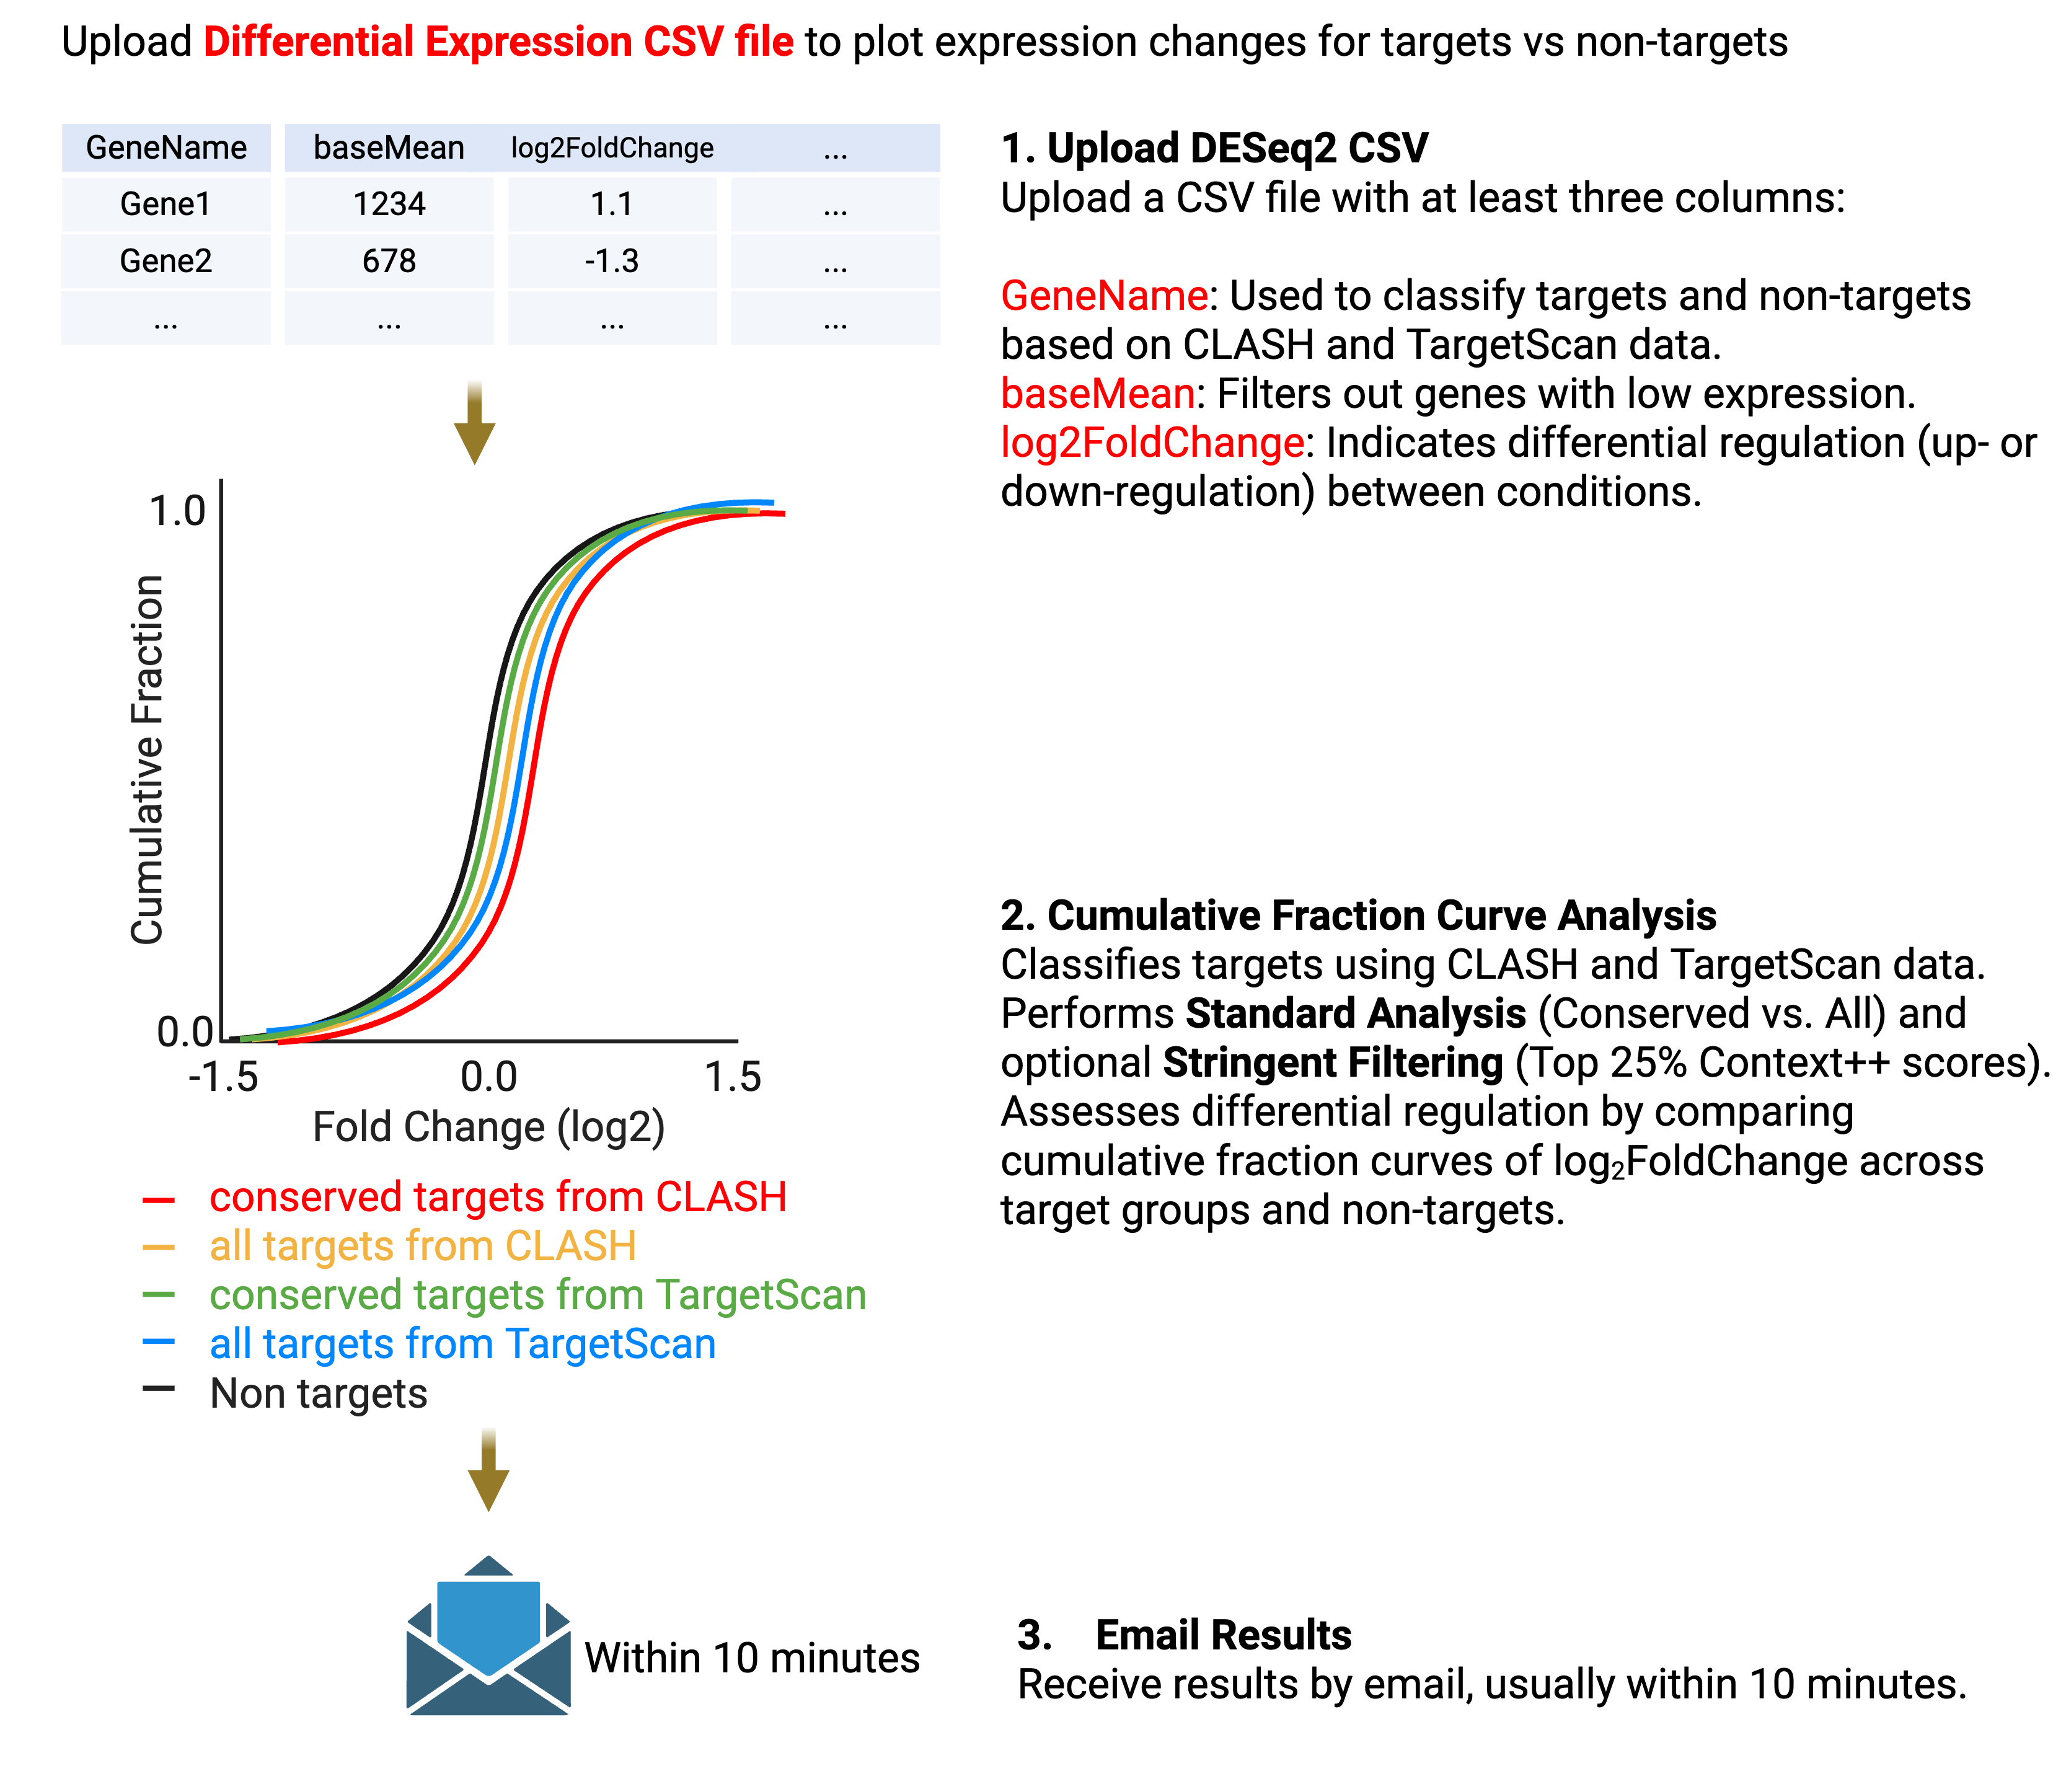
Cumulative fraction curve

Explore target abundance patterns from differential-expression results.

  1. 1Input
  2. 2Species
  3. 3Plot
  4. 4Submit
No file selected
✓ Standard Analysis
Groups targets into Conserved vs. All.
Focuses on Top 25% high-efficacy targets (mRNA 3' UTR only). Ref: Agarwal et al. (2015).